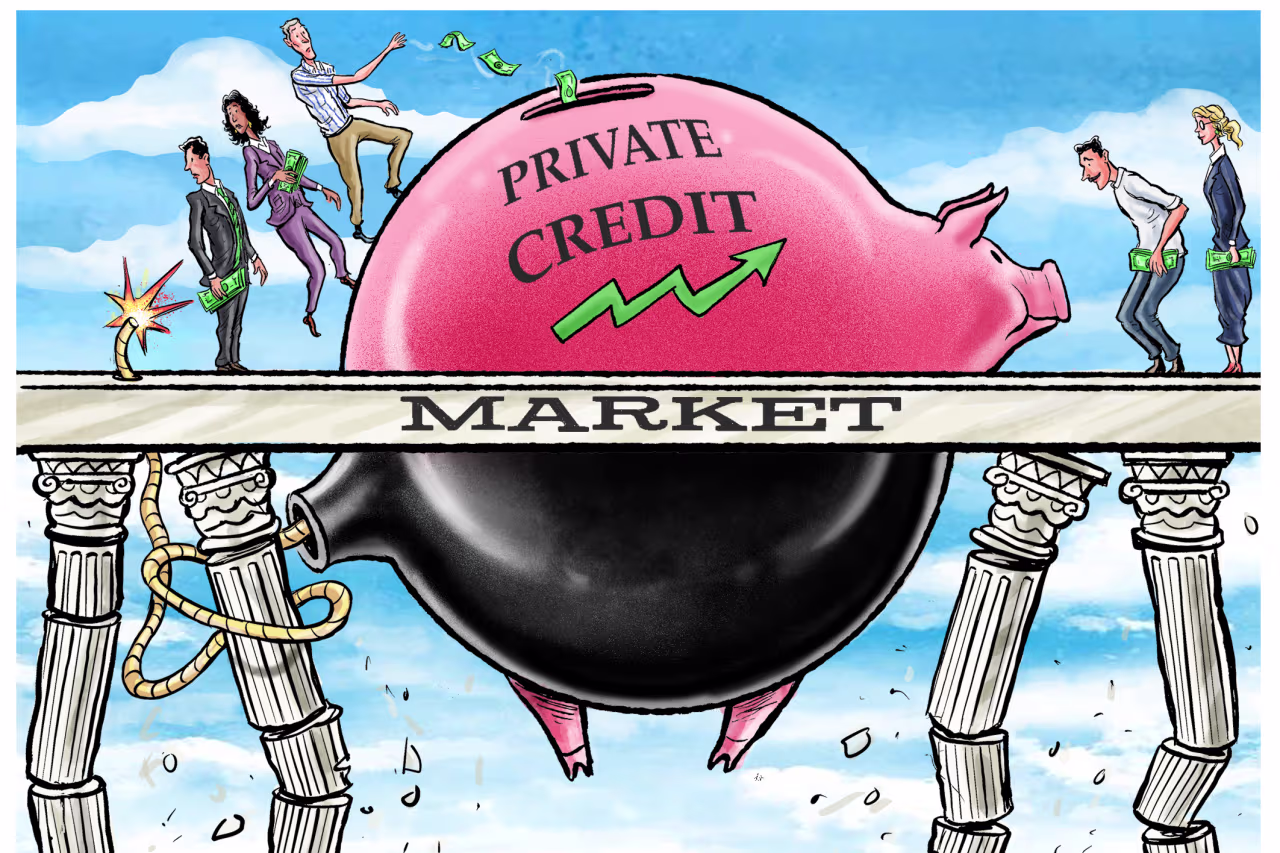
Private Credit Stress, Software Exposure, AI Disruption, and Systemic Spillovers
The private credit asset class has reached a scale of macroeconomic consequence, transforming from a niche middle-market financing tool into a $3.5 trillion global shadow-banking pillar. However, the most plausible systemic crisis emanating from this sector is not a rapid, 2008-style household insolvency spiral. Rather, the prevailing risk profile points to a protracted mix of corporate refinancing stress, deeply embedded fund-level leverage, and liquidity mismatches in retail-facing wealth channels.
Private Credit Stress, Software Exposure, AI Disruption, and Systemic Spillovers
Executive Brief
The private credit asset class has reached a scale of macroeconomic consequence, transforming from a niche middle-market financing tool into a $3.5 trillion global shadow-banking pillar. However, the most plausible systemic crisis emanating from this sector is not a rapid, 2008-style household insolvency spiral. Rather, the prevailing risk profile points to a protracted mix of corporate refinancing stress, deeply embedded fund-level leverage, and liquidity mismatches in retail-facing wealth channels.
The following analysis synthesizes the structural evolution, underwriting mechanics, and emergent vulnerabilities within private credit, yielding several foundational takeaways:
-
Software and AI Disruption as the Primary Fault Line: Software is vastly overrepresented in private credit, constituting roughly 20% of private credit exposure and 41% of recent global deal volume. Artificial intelligence disruption represents a structural credit shock to this cohort. It fundamentally undermines the historic underwriting pillars of software—recurring revenue durability, pricing power, and high switching costs—exposing highly levered, intangible-heavy balance sheets to sudden margin compression.
-
The Vintage Trap and Documentation Erosion: Deal quality has degraded materially. Vintages from 2020 to 2021 are plagued by covenant-lite documentation and aggressive EBITDA add-backs (historically capped at 5–25% but increasingly uncapped). As rates rose from 2022 to 2025, sponsors deployed aggressive liability management exercises (LMEs) and "Payment-in-Kind" (PIK) toggles to mask cash flow deficits, effectively deferring loss recognition.
-
Hidden Leverage and Interconnectedness: True leverage is not confined to the borrower's balance sheet. It is layered through fund finance vehicles, including subscription lines, Net Asset Value (NAV) facilities, collateralized loan obligations (CLOs), and synthetic risk transfers (SRTs). Large bank committed lending to private credit vehicles surged from $8 billion in Q1 2013 to approximately $95 billion by late 2024, demonstrating acute structural interconnectedness.
-
Systemic Transmission Channels: The transmission mechanism to the broader economy bypasses household mortgages. Instead, stress transmits via corporate capital expenditure reductions, forced selling in secondary markets, valuation shocks prompting bank margin calls on NAV facilities, and asset-liability mismatches on the balance sheets of pension funds and private equity-owned life insurers.
-
Baseline Data Anchors: Current market metrics illustrate emerging stress. In Q2 2025, U.S. Business Development Company (BDC) portfolios exhibited a ~1.2% non-accrual rate with a ~48.9% implied recovery on non-accruals. Broader direct lending defaults track near 1.8%, while distressed credits sit around 3.6%. Alarmingly, approximately 50% of software loans are rated B- or lower, placing them squarely in the most default-prone cohort.
A. Market Evolution and Causal Map
Timeline of Private Credit Growth (2008–Present)
The ascent of private credit is intrinsically linked to the regulatory fallout of the 2008 Global Financial Crisis (GFC). Basel III capital requirements and enhanced supervisory scrutiny inherently penalized banks for holding illiquid, highly leveraged, or lower-rated corporate loans on their balance sheets. This regulatory arbitrage created a structural vacuum in middle-market lending, which non-bank financial institutions rapidly filled.
-
2008–2014 (The Retrenchment): Banks pulled back from middle-market direct lending. Asset managers capitalized on the low-yield environment by offering institutional investors a yield premium in exchange for illiquidity. Direct lending during this era was characterized by strict maintenance covenants, smaller club syndications, and conservative, asset-backed underwriting.
-
2015–2019 (The Sponsor Synergy): Private equity (PE) activity accelerated dramatically. Private credit scaled symbiotically alongside the sponsor model, financing leveraged buyouts (LBOs) by offering customized terms, execution speed, and confidentiality. During this period, the structural decline in initial public offerings (IPOs) forced companies to stay private longer, driving capital formation and debt issuance deeper into opaque private markets.
-
2020–2021 (The Liquidity Boom and Covenant Erosion): Zero-interest-rate policies and massive capital inflows led to fierce competition among direct lenders. Deal sizes breached $1 billion, encroaching directly on the broadly syndicated loan (BSL) and high-yield (HY) markets. Covenant-lite structures, previously reserved for public markets, began dominating the private landscape.
-
2022–2025 (Rate Shock and Opacity): As base rates spiked, the floating-rate nature of private credit squeezed borrower interest coverage ratios. Rather than recognizing defaults, lenders and sponsors engaged in widespread "amend-and-extend" behavior, utilizing PIK interest to defer cash interest payments and mask underlying fundamental deterioration.
-
2026 (The Refinancing Wall and AI Shock): The market faces a dual shock of impending maturity walls and AI-driven business model disruption across its largest sector (software), forcing a harsh repricing of illiquidity premiums.
Market Plumbing and Leverage Architecture
Private credit is frequently, and erroneously, viewed as a largely unlevered provision of capital. In reality, leverage is intricately layered throughout the ecosystem. The fundamental "plumbing" maps from end investors to corporate borrowers, incorporating multiple intermediation nodes and "hidden levers."
-
End Investors: Pension funds, endowments, sovereign wealth funds, and increasingly, retail investors via semi-liquid wealth products and BDCs provide the foundational capital.
-
Intermediaries and Vehicles: Asset managers aggregate this capital into closed-end draw-down funds, perpetual BDCs, and private collateralized loan obligations (CLOs).
-
Fund-Level Leverage (The Hidden Levers):
- Subscription Lines (Capital Call Facilities): Short-term revolving bank credit secured by the uncalled capital commitments of Limited Partners (LPs). This facility artificially boosts the Internal Rate of Return (IRR) by delaying the actual calling of LP capital.
- NAV Facilities: Loans secured by the underlying net asset value of the fund's portfolio. Historically a niche product used at the end of a fund's life, NAV financing has exploded as funds seek liquidity to make distributions in a frozen IPO and M&A exit market. This creates "leverage on leverage."
- Synthetic Risk Transfers (SRTs): Banks offload the mezzanine or equity risk of their corporate loan portfolios to private credit funds. This optimizes bank regulatory capital while effectively creating a hidden loop of risk; the banking system relies on the liquidity of the shadow banking system to maintain its own capital ratios.
-
The Borrowers: Highly levered corporate entities, heavily skewed toward sponsor-backed technology and healthcare firms, carrying debt levels historically running at 5.0x to 7.0x EBITDA.
If private credit were to seize up, traditional banks are structurally incapable of stepping back in to replace the lost capital due to Basel IV and the Capital Requirements Directive (CRD VI). The immediate macroeconomic result would be a severe contraction in M&A, private equity exits, and corporate capital expenditure.
B. Underwriting Mechanics and "What Went Wrong"
Typical Deal Anatomy
The quintessential private credit transaction is the unitranche facility. A unitranche blends first-lien and second-lien economic risk into a single floating-rate debt instrument with a blended pricing rate. This structure dominates software and technology buyouts because it allows borrowers to avoid negotiating complex, time-consuming intercreditor agreements between disparate lender syndicates.
To facilitate rapid capital deployment, deals frequently utilize Original Issue Discount (OID). OID allows lenders to enhance their effective yield without raising the nominal coupon rate, effectively funding less than the par value of the loan while demanding repayment at par. Furthermore, Payment-in-Kind (PIK) toggles allow a distressed borrower to capitalize interest into the principal balance rather than paying cash. While PIK preserves near-term liquidity, it exponentially increases the ultimate debt burden, ensuring a significantly lower recovery rate if the enterprise value fails to grow commensurately.
Vintage Drift and the Erosion of Deal Quality
The trajectory of private credit documentation over the last decade illustrates a severe degradation of lender protections, directly correlated to the saturation of dry powder and intense competition among managers:
-
2012–2019 Vintages (The Middle-Market Standard): Deals were characterized by maintenance covenants (e.g., maximum net leverage and minimum interest coverage tested quarterly). These covenants served as tripwires, granting lenders an early warning system to force a restructuring, mandate equity cures from the sponsor, or seize board control before enterprise value evaporated.
-
2020–2021 Vintages (The Cov-Lite Peak): Abundant capital and intense sponsor competition pushed terms heavily in favor of borrowers. Private credit adopted incurrence covenants (cov-lite), which only restrict specific actions (like taking on new debt or paying dividends) rather than requiring continuous financial health. By 2024, nearly 40% of upper-middle-market private credit deals were structured as cov-lite, removing the lender's ability to intervene early in a deteriorating credit.
-
2022–2025 Vintages (Stress Masking and Structural Loopholes): As rates rose, the focus shifted to exploiting documentary loopholes. EBITDA add-backs became a focal point of abuse. Deal documentation permits borrowers to calculate leverage ratios based on "Adjusted EBITDA." Historically capped at 5–10% of total EBITDA, these add-backs allow companies to credit themselves for projected "run-rate synergies" or theoretical cost savings. In recent vintages, these caps were frequently pushed to 25% or eliminated entirely, rendering the leverage ratios largely fictitious.
Furthermore, loose definitions surrounding "unrestricted subsidiaries," generous "baskets," and "portability" (allowing a change of control without triggering debt repayment) have created trapdoors in the documentation. Sponsors have utilized these provisions to engage in liability management exercises (LMEs), stripping collateral away from the primary credit group to secure new rescue financing.
C. Stress Concentration: Software and AI Disruption
The Disproportionate Software Overweight
Stress in the private credit market is highly concentrated. Software accounts for approximately 20% of total private credit exposure and represents an astonishing 41% of recent global deal volumes. Within the broader leveraged loan market, tech borrowers represent roughly $260 billion in outstanding debt, with 60% localized in software. Alarmingly, approximately 50% of software loans are rated B- or lower, placing them in the most default-prone cohort.
Lenders aggressively courted the software sector based on the historical premise of high recurring revenue (SaaS), predictable churn, strong gross margins, and asset-light scalability. Consequently, software borrowers were granted uniquely high leverage tolerance, often underwritten on Annual Recurring Revenue (ARR) rather than positive free cash flow.
However, software presents a structurally weak collateral profile. The "assets" are heavily intangible (codebases and customer lists). If the enterprise value collapses, unitranche lenders have no physical plant, inventory, or equipment to liquidate, leading to inherently lower recovery rates in distress.
Mechanisms of AI Disruption
Artificial intelligence—specifically generative and agentic AI—has transitioned from an equity market hype cycle into a tangible, fundamental credit risk. AI introduces severe execution and margin risks for heavily levered legacy software businesses through several interconnected vectors:
-
Erosion of Switching Costs: Generative AI dramatically accelerates code migration, API integration, and data translation. This lowers the frictional cost for enterprise customers to abandon entrenched legacy systems in favor of cheaper, more agile alternatives.
-
Deflation of Seat-Based Pricing (Seat Churn): Traditional SaaS monetizes via "per-seat" human licenses. As AI agents execute tasks autonomously across legal, financial, marketing, and sales workflows, enterprise customers require fewer human workers. This directly compresses seat license volumes, breaking the fundamental SaaS revenue growth model.
-
Commoditization and Pricing Power Loss: AI reduces the barriers to entry and the marginal cost of developing software solutions. Features that once justified premium pricing can now be replicated rapidly by AI-native entrants. This forces legacy providers into defensive price cuts to maintain market share, destroying net revenue retention (NRR).
-
Margin Compression from the Compute Arms Race: To remain relevant, legacy software companies are forced to integrate AI capabilities. This requires massive, previously unbudgeted capital expenditures for compute power, cloud inference costs, and specialized engineering talent. For a highly levered portfolio company, this required expenditure directly diverts free cash flow away from debt service, triggering liquidity crises.
The elevated risk in private credit is driven by all three factors—rates, competition, and AI. High base rates drain cash flows and expose the underlying fragility; hyper-competition generated the weak, cov-lite documentation that prevents early lender intervention; and AI disruption serves as the idiosyncratic, terminal catalyst that destroys the fundamental enterprise value of the borrower.
Subsector Vulnerability Analysis
The disruption risk is not uniform across the technology landscape:
-
High Risk (Disrupted): Horizontal SaaS, customer experience (CX) outsourcing, marketing technology (MarTech), basic IT service management (ITSM), and developer tools (DevTools). These tools lack proprietary data moats, feature tasks easily replicated by large language models, and suffer from high product substitutability.
-
Resilient (Defended): Vertical SaaS (e.g., life sciences, specialized construction ERPs), cybersecurity, data infrastructure, and regulatory compliance platforms. These sectors benefit from deep integration into physical workflows, massive proprietary data sets that train bespoke models, and high regulatory barriers to entry.
Borrower-Level AI Disruption Scoring Rubric
To underwrite AI risk systematically, credit risk committees must deploy a rigorous scoring matrix. Score each dimension 0 (Exposed) to 2 (Defended). A total score below 10 indicates severe structural refinancing/margin risk requiring immediate structural enhancements, pricing premiums, or deal avoidance.
| Risk Dimension | 0 — Weak / Exposed | 1 — Moderate / Transitional | 2 — Strong / Defended |
|---|---|---|---|
| Revenue Contract Durability | Month-to-month, easy termination rights. | Annual contracts, standard renewals. | Multi-year locked contracts, high penalties. |
| Monetization Model | Purely seat-based, highly sensitive to human headcount reductions. | Hybrid usage-based with potential for optimization. | Consumption-based, directly tied to AI compute or outcome generation. |
| Switching Costs & Embedding | Point solution, easily decoupled via API, low retraining cost. | Moderate workflow integration, partial data siloing. | Core operating system, heavy regulatory/compliance tie-in, massive retraining cost. |
| Proprietary Data Advantage | Relies entirely on public, easily scraped, or replicable data. | Siloed client data, but lacks mission-criticality. | Proprietary, real-time, mission-critical data required for LLM accuracy. |
| Pricing Power (Commoditization) | Subject to open-source replication; forced into price-down renewals. | Can maintain current ACV but unable to raise prices. | Proven ability to upsell AI features and hold premium ACV. |
| Product Substitutability | Features easily cloned by AI-native entrants in days/weeks. | Complex to replicate fully, requires domain knowledge. | Deeply embedded vertical expertise; AI acts as an enabler, not a replacement. |
| Margin Resilience (AI Cost Stack) | High API/inference costs destroying gross margins; unable to pass on costs. | Able to pass costs to customer, maintaining flat margins. | Negligible increase in COGS; owns proprietary small models. |
| Distribution Control | Reliant on hyperscalers or vulnerable channel partners. | Direct sales, but facing longer enterprise sales cycles. | Embedded ecosystem effect; universal industry recognition. |
| Leverage & Interest Coverage | Low headroom, highly sensitive to SOFR; requires immediate refinancing. | Moderate cash flow buffer. | Ample free cash flow; fixed-rate or heavily hedged debt. |
| Sponsor Support Capacity | Sponsor out of capital, unwilling to provide equity cures. | Sponsor willing to fund basic operational runway. | Deep pocket sponsor actively funding strategic AI pivot. |
D. Return Profile Reality Check
Historical Return Decomposition
The historical return of private credit is not a monolithic figure; it is a composite derived from several distinct, mechanical inputs:
Total Return = Base Rate + Credit Spread + OID/Upfront Fees + Prepayment Penalties – Expected Loss Rate – Workout Frictions
Historically, private credit offered a structural premium of 300 to 400 basis points over broadly syndicated loans. However, this premium is heavily misunderstood. It is a blend of an illiquidity premium (compensation for the inability to trade the asset on a secondary market) and a complexity premium (compensation for bespoke structuring, sourcing, and active monitoring).
The Compression Reality
As the asset class swelled to $3.5 trillion globally, massive amounts of dry powder chased a finite pool of high-quality assets. This dynamic caused a mechanical compression of returns long before actual borrower defaults materialized:
-
Spread Compression: First-lien middle-market direct lending spreads tightened aggressively to ~500 bps by Q4 2025, narrowing the yield premium versus syndicated loans significantly. The complexity premium has essentially evaporated.
-
Covenant Value Destruction: Looser covenants and the lack of structural amortization dictate that the duration of the loan extends, and the recovery rate upon default falls. If the historical direct lending recovery rate drops from 70% to 45% due to cov-lite structures and intangible asset bases, the expected loss rate mathematically consumes the entirety of the remaining illiquidity premium.
-
PIK Dilution: A rapidly rising share of total interest income is comprised of PIK (in some BDC portfolios, PIK exceeds 10% of total income). While this supports the reported top-line yield and flat NAV marks, it does not generate distributable cash flow. This severely distorts the true risk-adjusted cash return and builds a larger principal balance that is increasingly unlikely to be recovered in a downside scenario.
Compared to High Yield (HY) and Investment Grade (IG) bonds, private credit continues to advertise lower volatility. However, this is largely an artifact of "volatility laundering" via mark-to-model accounting, rather than genuine structural safety.
E. Systemic Risk and Transmission Channels
The systemic risk of private credit does not mirror the 2008 subprime mortgage crisis; it will not trigger a catastrophic, overnight run on depository institutions. Instead, it represents a slow, grinding contagion that transmits through interconnected institutional balance sheets and the real economy.
-
The Real Economy and Corporate Capex: Private markets finance a massive swath of operating companies. As debt service burdens crush portfolio companies, private equity sponsors react by aggressively cutting capital expenditures, pausing hiring, and executing mass layoffs to preserve cash flow. In jurisdictions like the UK, where PE-backed corporates represent a material share of total employment, this translates directly into localized recessions, subdued aggregate demand, and wage stagnation.
-
The Bank Transmission Channel (Indirect Links): Banks are not isolated from private credit; they provide the leverage that fuels it. Bank exposures have transformed from holding direct leveraged loans to extending senior secured warehouse lines, subscription facilities, and NAV loans to private credit funds. In a severe stress scenario, mark-to-market write-downs in private credit portfolios trigger loan-to-value (LTV) breaches on NAV facilities. This forces bank margin calls, compelling funds to liquidate assets into an illiquid market or forcing banks to take sudden capital charges.
-
Institutional Contagion (Pensions & Insurers): Pension funds, endowments, and life insurers have pivoted heavily into private credit to match long-term liabilities. PE-owned U.S. insurers alone now manage over $700 billion in assets. If private credit experiences a spike in defaults or severe rating downgrades (particularly in CLO tranches), insurers will face punitive capital charges under National Association of Insurance Commissioners (NAIC) Risk-Based Capital (RBC) rules. This forces a pro-cyclical liquidation of assets, portfolio rebalancing, and a sudden cessation of new capital deployment.
-
The Retail Liquidity Mismatch and Secondary Repricing: The democratization of private credit via interval funds, non-traded BDCs, and European Long-Term Investment Funds (ELTIFs) has introduced "run risk." Retail vehicles offer periodic liquidity (e.g., 5% quarterly redemptions) against inherently illiquid loans. When sentiment sours, these funds must gate redemptions. This sparks a crisis of confidence that bleeds into the secondary market for LP stakes and crushes the publicly traded equity values of the alternative asset managers themselves.
-
The Feedback Loop (Fundraising Freeze): As distributions to LPs halt (due to lack of M&A exits and tied-up capital), a fundraising freeze ensues. Less fresh capital forces extreme lender discipline, which in turn causes the refinancing risk for existing borrowers to spike, creating a self-reinforcing downward spiral of defaults.
Unlike 2008, where losses devastated the banking system and household equity, the losses in a private credit crash are absorbed primarily by locked-up institutional capital (pensions, endowments, sovereign wealth), PE sponsors losing their equity checks, and mass-affluent retail investors trapped in gated BDCs.
F. 2008 Comparison: Similarities and Differences
Regulators globally, including the Bank of England and the Financial Stability Oversight Council (FSOC), frequently compare the current private credit expansion to the pre-2008 shadow banking system. A rigorous analytical comparison reveals striking structural parallels, but entirely different failure vectors.
The Similarities
-
Layered Leverage: Just as 2008 featured Collateralized Debt Obligations (CDOs) backed by RMBS, 2026 features NAV facilities layered on top of levered portfolio companies, held within CLOs or BDCs utilizing their own structural leverage.
-
Model Risk and Complacency: The 2008 crisis relied on flawed rating agency models that underestimated correlated defaults in subprime mortgages. Today, private credit relies on opaque, internally generated "mark-to-model" valuations that delay the recognition of volatility, allowing managers to project artificial stability.
-
Maturity Transformation: Utilizing short-term bank financing (subscription lines and warehouse facilities) to fund highly illiquid, 5-to-7 year corporate loans introduces inherent liquidity mismatch risks.
-
Refinancing Cliffs: Both eras featured a massive wall of debt coming due simultaneously in an environment where the underlying asset values had deteriorated.
The Differences
-
Where the Losses Sit: In 2008, losses hit highly levered bank balance sheets, directly impairing the global payment, clearing, and deposit system. Today, bank capital rules (Basel III/IV) have pushed the risk outward. Losses sit primarily with institutional capital and wealthy retail investors. Wealth destruction occurs, but immediate depository insolvency does not.
-
The Underlying Asset: The 2008 crisis was a household balance sheet crisis predicated on subprime mortgages. The private credit stress is a corporate balance sheet crisis predicated on middle-market operating companies (specifically software and healthcare).
-
Liquidity Structure: Unlike open-ended mutual funds or bank deposits facing daily liquidity requirements, the vast bulk of private credit sits in closed-end draw-down funds with 7-to-10 year lock-ups. This structural illiquidity acts as a circuit breaker, preventing forced fire sales from spiraling out of control.
G. "Correction vs. Crash" Scenarios
Using baseline data from KBRA, Fitch, and BDC aggregates, the following scenarios quantify the expected trajectory of stress.
| Scenario | Macro / Market Drivers | Expected Default Rate (12–24m) | Recovery Band (1L / Unitranche / 2L) | Systemic Impacts & Forced Actors |
|---|---|---|---|---|
| 1. Mild Correction | Spreads widen ~150 bps. Base rates fall slowly. Selective AI repricing in legacy software. Refinancing is available but costly. | ~2%–4% (Concentrated in B- rated software / consumer). | 55–70% / 45–60% / 20–40% | Retail BDCs gate redemptions to manage liquidity. Lenders enforce tighter covenants on new tech issuance. No broad macroeconomic contagion. |
| 2. Severe Recession & Refinancing Cliff | Broad EBITDA compresses by 15–20%. High interest burdens persist. M&A exit windows close entirely. | ~6%–10% (Smaller, lower-middle market borrowers reach double digits). | 40–60% / 30–50% / 10–30% | Bank margin calls on NAV facilities force secondary asset sales at deep discounts. Insurers face NAIC capital charge triggers, halting new allocations. |
| 3. AI Margin Shock + Higher-for-Longer | Generative AI destroys SaaS seat pricing. LLM compute capex spirals. High base rates drain cash flows. | ~4%–6% (Overall), but ~8%–12% specifically within the Software subset. | 45–65% / 30–55% / 10–30% | Extreme restructuring volume. Sponsors walk away from underwater equity. Massive PIK dilution. Tech issuance stalls. Listed alternative managers suffer severe equity price collapse. |
H. Case Studies: How Private Credit Breaks
The mechanics of private credit stress are already visible in recent high-profile restructurings and liquidity events.
1. Pluralsight: The Sponsor Liability Management Exercise (LME)
- Capital Structure: In 2021, Vista Equity Partners took ed-tech firm Pluralsight private for $3.5 billion, financed by a $1.175 billion unitranche loan from private lenders including Blue Owl and Ares.
- What Broke: Facing high cash-burn and rising SOFR rates, the software company's EBITDA margins collapsed.
- Timeline & Action: In mid-2024, exploiting weak covenants and generous basket allowances, Vista engineered a "drop-down" transaction (a J.Crew-style trapdoor). They shifted core intellectual property into a new unrestricted subsidiary to raise $50 million in rescue financing, effectively priming the existing lenders. Vista ultimately handed the keys to the lenders when the LME proved insufficient.
- Lessons for Underwriting: The myth of the "collegial" private credit club is dead. Private credit is no longer immune to the aggressive priming tactics of the syndicated market. Cov-lite documentation explicitly enables sponsors to strip collateral, drastically reducing lender recovery values. Lenders must demand strict "Chewy/J.Crew" blocker provisions.
2. First Brands Group: Fraud, Opacity, and Off-Balance Sheet Leverage
- Capital Structure: An automotive parts manufacturer carrying $6.1 billion in on-balance sheet debt spread across major private credit funds (e.g., Marathon, Monroe Capital) and banks.
- What Broke: The company filed for Chapter 11 in September 2025 revealing $10 to $50 billion in total liabilities against minimal assets. A systematic fraud involved $2.3 billion in fabricated receivables and the double/triple pledging of collateral to multiple lenders.
- Timeline & Action: The opacity of private markets allowed the company to hide massive factoring and supply-chain finance obligations. Hedge funds engaged in brutal infighting; Marathon Asset Management executed a highly profitable DIP-financing flip (yielding 162%), while UBS O'Connor took a $150 million write-down on hidden exposures.
- Lessons for Underwriting: "Secured" lending is a fiction without rigorous, independent collateral tracing and auditability of Special Purpose Vehicle (SPV) governance. The case exposed the severe lack of diligence in late-cycle private credit deployment and the catastrophic risk of unsecured trade credit.
3. BlackRock TCP Capital: The Leverage Magnifier and Public Marks
- Capital Structure: A publicly traded BDC utilizing fund-level debt to enhance yields.
- What Broke: The BDC slashed its Net Asset Value (NAV) by 19% in a single quarter (Q4 2025). The losses were concentrated in six companies, notably Edmentum, an ed-tech software provider suffering from AI disruption and margin compression.
- Timeline & Action: The true lesson was financial leverage. The BDC's borrowing increased market exposure to 230%. An underlying unlevered portfolio loss of roughly 8% was mathematically amplified by fund-level debt into a 19% destruction of shareholder NAV. Furthermore, assets previously marked at par were written down to zero in weeks, exposing the fragility of mark-to-model valuations.
- Lessons for Underwriting: Leverage at the vehicle level transforms moderate credit volatility into fatal equity drawdowns. Equity and warrant co-investments within debt vehicles create highly correlated downside convexity.
4. Tricolor Auto Group: Systemic Internal Control Failures
- Capital Structure: A subprime auto lender operating heavily in the private credit space via asset-backed lending (ABL) and warehouse lines.
- What Broke: The firm collapsed into Chapter 7 liquidation in 2025 amid allegations of "double-pledging" the same pool of auto loans to secure credit lines from multiple different banks, alongside tens of thousands of fictitious receivables.
- Lessons for Underwriting: Asset-backed private credit is entirely dependent on data integrity. The chase for yield caused lenders to bypass fundamental verifications of borrowing base certificates. AI-driven proprietary credit scoring models can mask fundamental subprime deterioration.
5. Blue Owl and Blackstone: The Wealth Channel Liquidity Squeeze
- Capital Structure: Large alternative managers operating semi-liquid BDCs and private credit funds distributed to retail and high-net-worth investors.
- What Broke: As sentiment soured in early 2026 surrounding software AI risks, retail redemption requests spiked. Blackstone's flagship BCRED saw $3.7 billion in withdrawals in a single quarter (7.9% of the fund), forcing the firm to raise its withdrawal cap and inject employee capital to satisfy requests.
- Timeline & Action: Blue Owl permanently removed a quarterly withdrawal option for one of its vehicles and was forced to sell $1.4 billion of assets to manage liquidity.
- Lessons for Underwriting: Offering periodic liquidity (e.g., 5% quarterly) against inherently illiquid, hard-to-value private loans is structurally flawed. Liquidity management, rather than actual credit default, becomes the dominant narrative and risk vector for the asset manager.
I. Global Nuance: The Regional Divergence
The private credit landscape is not geographically uniform. Regulatory architecture, bank dominance, and distribution channels heavily dictate market structure across borders.
-
United States: The U.S. is the most mature, deepest, and most aggressive market. It is dominated by non-banks, BDCs (14% of the market), and highly levered cov-lite unitranche deals. Yields are driven by SOFR, and the market can swallow $1 billion+ deals effortlessly, acting as a direct replacement for the broadly syndicated loan market.
-
Europe: Rapidly growing (EUR 141bn loan issuance in 2025), but fundamentally more conservative. European deals feature less leverage (typically 0.25x–0.5x lower than U.S. equivalents), stricter maintenance covenants, and a higher prevalence of club deals. Retail distribution relies heavily on European Long-Term Investment Funds (ELTIFs), distributed predominantly through established private bank channels.
-
United Kingdom: The Bank of England is actively probing private credit systemic risks via its System-Wide Exploratory Scenario (SWES). Regulators are acutely aware that post-GFC capital rules pushed small and medium-sized enterprise (SME) lending almost entirely into the shadow banking sector, creating a vital dependency.
-
Canada: The private credit footprint is severely constrained domestically by the entrenched oligopoly of the Big Six banks, which control approximately 90% of lending and operate under different regulatory incentives than U.S. banks. Consequently, Canadian exposure is largely limited to massive Canadian pension funds and insurers acting as LPs in U.S. and European private credit funds.
J. Risk Dashboard and Deal Quality Checklists
Top 10 Monthly Risk Indicators
| # | Risk Indicator | Rationale / Signal |
|---|---|---|
| 1 | BDC Non-Accrual Rates & Implied Recoveries | The truest leading indicator of underlying middle-market cash flow health. |
| 2 | PIK as a % of Total Interest Income | Signals the masking of cash flow deficits and future principal recovery risk. |
| 3 | Discount/Premium to NAV of Listed Vehicles | Reflects public market confidence in private "mark-to-model" valuations. |
| 4 | Redemption Run Rates in Semi-Liquid Funds | Tracks liquidity strain and panic in the retail wealth channel. |
| 5 | Bank NAV / Subscription Line Utilization | Rapid drawdowns indicate funds cannot access public markets or organic cash flow for distributions. |
| 6 | Spread Compression vs. BSL | Measures the evaporation of the illiquidity/complexity premium. |
| 7 | Frequency of Sponsor LMEs / Priming | Indicates sponsor willingness to burn lender relationships to salvage underwater equity. |
| 8 | Software Refinancing Maturity Walls | Specifically tracking the clustering of tech maturities in a high-rate environment. |
| 9 | Direct Lending Default Rate (KBRA/Fitch) | Compared against historical averages (e.g., 1.8% current vs. 6.4% recessionary). |
| 10 | NAIC Regulatory Capital Changes | Any shift in capital charges for insurers holding CLO equity or residual tranches. |
Deal-Quality Checklist: Red Flags
Red Flags:
- Uncapped EBITDA Add-backs: Permitting limitless adjustments for "projected synergies" entirely invalidates leverage metrics and strips covenant protection.
- Springing Covenants Only: Covenants that only activate if the revolver is drawn past 35–40%, offering zero protection during standard operations.
- Weak Collateral Transfer Restrictions: Lack of "J.Crew" or "Chewy" blocker provisions, allowing sponsors to move IP into unrestricted subsidiaries.
- Automatic PIK Toggles: Allowing the borrower to unilaterally switch to PIK interest without lender consent or punitive rate step-ups.
- High Leverage with Zero Amortization: 6.0x+ leverage with bullet maturities shifts all risk to the terminal refinancing window.
Conclusion
The private credit ecosystem has permanently altered the architecture of global corporate finance. While it provides vital, flexible capital to the real economy, the convergence of peak-vintage underwriting indiscipline, a fundamental technology shock in its most concentrated sector, and the introduction of retail liquidity promises against illiquid assets has created a highly fragile equilibrium. When the market corrects, the pain will manifest in frozen fund distributions, massive PIK dilution, decimated recovery rates, and plunging equity values for alternative asset managers. Institutions must immediately pivot from a deployment-focused strategy to ruthless vintage selection and active AI-disruption modeling.
Appendix: Glossary of Private Credit Terms
- Private Credit: Nonbank bilateral or club corporate credit negotiated outside public securities markets, historically serving the middle market but now competing for large-cap LBOs.
- Unitranche: A single debt facility combining first-lien and second-lien economics into one blended rate; highly common in software buyouts where hard collateral is weak.
- Maintenance Covenant: A financial metric (e.g., Debt/EBITDA) that a borrower must comply with continuously or at the end of each reporting quarter.
- Incurrence Covenant (Cov-Lite): A rule that is only tested when the borrower takes a specific action, such as issuing new debt or making an acquisition.
- PIK (Payment-in-Kind): A feature allowing the borrower to pay interest by adding it to the principal loan balance rather than paying in cash, preserving liquidity but increasing ultimate loss severity.
- Subscription Line (Capital Call Facility): Fund-level borrowing backed by the uncalled capital commitments of investors.
- NAV Facility: Fund-level borrowing backed by the net asset value of the fund's underlying portfolio companies.
- Synthetic Risk Transfer (SRT): A transaction where a bank transfers the credit risk of a loan portfolio to a third party (often a private credit fund) to gain regulatory capital relief.
Works Cited
-
Strong growth sees private credit market reach US$3.5 trillion — AIMA
-
Private Credit Stress, Software Exposure, AI Disruption, and Systemic Spillovers.docx
-
AI Impact On Business And Technology Services — S&P Global Ratings
-
Private Credit Pressure Points: Vintage Matters More Than Size — S&P Global
-
Record Dry Powder Fuels Documentation Deterioration and PIK Proliferation — ABF Journal
-
Basel Committee publishes analysis of synthetic risk transfers — BIS
-
The NAIC's Evolving Response to Private Equity in Insurance — Clifford Chance
-
Reed Smith's Summary of the 9th Annual European Fund Finance Symposium 2025
-
The Rise of Private Credit: 2026 Market Trends and Growth Outlook — Creative Planning
-
A Tale of Two Credit Cultures: Key Differences Between U.S. and European Private Credit Markets
-
Rate and Credit View: When AI Disruption Meets Leveraged Balance Sheets — LPL Financial
-
Semi-Liquid Private Credit: A Quiet Revolution — Morgan Stanley
-
NAV facilities – the investor's perspective — Global Legal Insights
-
Europe vs US Private Credit: Pricing, Documentation, and Deal Flow Trends
-
UK House of Lords Committee report on growth of UK private markets — A&O Shearman FinReg
-
Leveraged Finance: Loose Maintenance Covenants Permeate Private Credit — S&P Global
-
Erich Durlacher Quoted in the Private Debt Investor on the Pluralsight Restructuring — Burr
-
AI Disruption Worries Spill Over To Private Credit Markets — S&P Global
-
Why AI Worries About Software Are Hitting Private Credit — Morningstar
-
Markets Weigh Impact of AI on Software Sector — T. Rowe Price
-
Private Credit: Capital Markets Forecast — Russell Investments
-
European Debt Markets: Quarterly Insights #1 2026 — Carlsquare Corporate Finance
-
Private credit market to hit $2T this year, with declining defaults – Moody's — PitchBook
-
BlackRock TCP 19% NAV Reduction Driven by Loans Previously Marked Near Par — Octus
-
The Twilight of Liquidity: Signs of the Turning Credit Cycle — McGill Business Review
-
The Bank of England's private markets system-wide exploratory scenario exercise
-
Transformed Intermediation: Credit Risk to NBFIs, Liquidity Risk to Banks — NBER
-
Private Markets Monthly, December 2025: Private Credit Trends To Watch In 2026 — S&P Global
-
Private Credit: Impact of Pluralsight's Potential Restructuring — KBRA
-
A Buyout Gone Wrong Creates Fireworks in The Private Credit Market — Scribd
-
Pluralsight Change of Control Transaction – The Tip of the Private Credit Iceberg? — Goodwin
-
First Brands Bankruptcy Underlines Scope of Private Credit Exposures — McKool Smith
-
BlackRock TCP Capital's Tumble Was More Than Just Private Credit Risk — Morningstar
-
Blackrock TCP Capital Q4 Earnings Call Highlights — MarketBeat
-
Why BDC troubles might be hard to shake off — Private Debt Investor
-
Financial Services Regulation Committee publishes private markets report — UK Parliament
-
Private Credit Laws and Regulations 2026: Canada — Global Legal Insights
-
New players, old risks: Financial stability in a changing landscape — Bank of Canada