GE Vernova
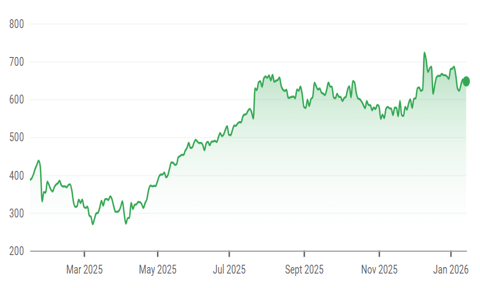
Company Snapshot & Price Performance
Source: Bloomberg, FactSet
Recent Reported EPS
| Quarter | EPS | Quarter | EPS |
|---|---|---|---|
| 2025E | 7.04 | 2027E | 18.21 |
| 2026E | 12.55 |
Recent Share Price Trend
Executive Summary
Investment Thesis
Most Leveraged Public-Market Play on the AI Power Supercycle
GEV sits on both sides of the bottleneck: 1. gas power generation and electrification equipment 2. as AI and hyperscale data centers drive a structural step-up in U.S. electricity demand not seen since the post-war industrial boom.
Q3 orders surged +55% YoY to $14.6B, confirming this is physical electricity demand, not just AI enthusiasm. Load growth is outpacing grid upgrades, creating an urgent, multi-year need for firm generation and grid equipment that GEV is uniquely positioned to supply.
The market still frames GEV as a legacy industrial spin-off rather than a structural beneficiary of the power supercycle. Consensus underestimates the duration and magnitude of the demand curve, historical electricity consumption data and third-party forecasts (McKinsey, NEMA, EIA) all point to demand inflecting well above trend through 2050.
Electrification Inflection Driven by Prolec GE & Grid Bottlenecks
Electrification is among the fastest-growing segments in global electrical equipment, with power transformer revenue forecast to nearly double from ~$50B to ~$95B by 2030, and GEV's Prolec GE acquisition locks in share at a ~7× EBITDA entry multiple, far below peers.
Severe transformer shortages and grid modernization are driving outsized demand. North America mix is rising to 40–50% of segment sales, and NA grid bottlenecks give GEV regional pricing power that asset-light peers lack. Prolec GE adds ~$0.8B in 2028 EBITDA.
The market has not yet fully priced in the margin and revenue uplift from Prolec GE, nor the scarcity value of owning physical transformer manufacturing capacity during a multi-year shortage cycle. Peers without installed NA capacity cannot replicate this positioning at comparable multiples.
Backlog Visibility & Operating Leverage Drive Earnings
A $135B+ total backlog provides multi-year revenue visibility, while 50–60% operating leverage amplifies pricing and volume gains, driving EBITDA from ~$1.6B (2024) to ~$9.8B by 2028.
Long-cycle equipment and high-margin services improve earnings quality. Backlog converts demand into predictable earnings, and the Electrification segment is inflecting from negative margins in 2022 toward double-digit margins by 2027–2028 per Barclays estimates.
Consensus models underweight the non-linear margin expansion inherent in GEV's operating leverage. A 6× EBITDA swing in four years is not priced into a stock still viewed through the lens of GE's legacy conglomerate discount rather than as a pure-play power infrastructure compounder.
Business Model & Economics
Revenue Streams
- Power (largest EBITDA contributor): Heavy-duty gas turbines (HDGTs), steam turbines, small modular reactor technologies, and high-margin recurring revenue through long-term service agreements (LTSAs/SRAs). Q3 orders of $7.81B with backlog at $84.06B.
- Electrification (fastest-growing): Transformers, switchgear, substations, and grid infrastructure equipment. Q3 orders of $5.11B with backlog at $30.18B. Growth accelerated by the Prolec GE acquisition, which expanded transformer manufacturing capacity.
- Wind (non-core): Onshore and offshore wind turbines. Relatively small contributor and not a material driver of valuation.
Pricing Model
GEV operates a long-cycle equipment + services model. Large equipment (gas turbines, transformers) is sold on multi-year contracts, often with locked-in pricing escalators. Service agreements generate recurring, higher-margin revenue over the installed base's 20–30 year life. Grid bottlenecks and transformer shortages give GEV regional pricing power in North America that asset-light peers cannot replicate.
Cost Structure
Key cost drivers include raw materials (steel, copper, rare earth elements), manufacturing labor, and R&D across turbine and grid equipment platforms. The business benefits from 50–60% operating leverage, meaning incremental revenue drops through to EBITDA at outsized rates as fixed manufacturing costs are absorbed across higher volumes.
Unit Economics
Key Metrics
- Backlog per Segment: Power $84.06B / Electrification $30.18B / Total $135B+
- Prolec GE Acquisition Multiple: ~7× EBITDA, far below peer transaction comps
- Prolec GE Incremental EBITDA: ~$0.8B by 2028
- Operating Leverage: 50–60% on incremental revenue
- EBITDA Trajectory: ~$1.6B (2024) → ~$9.8B (2028E), a ~6× expansion
Economies of Scale
As GEV's installed base grows, the services mix increases as a percentage of revenue, driving structurally higher margins. Transformer manufacturing capacity (expanded via Prolec GE) is a scarce physical asset — competitors cannot quickly replicate it, meaning GEV's cost-per-unit advantage widens as utilization rises. The Power segment's LTSA book compounds as every turbine sold locks in decades of high-margin service revenue.
Economic Moat
Moat Sources
1. Cost Advantages
- Scale economies in gas turbine and transformer manufacturing across a global footprint
- Process advantages from decades of engineering IP inherited from GE's legacy power business
- Location advantages via Prolec GE's North American transformer manufacturing — NA grid bottlenecks make domestic production capacity a scarce, high-value asset
2. Switching Costs
- Integration depth: Gas turbines and grid equipment are embedded in utility infrastructure with 20–30 year operational lives
- Financial switching costs: Utilities have multi-year LTSAs tied to GEV's installed base; switching mid-contract is prohibitively expensive
- Procedural switching costs: Retraining operations teams, re-certifying equipment, and re-engineering plant interfaces create high inertia
3. Network Effects
- Indirect network effects: A larger installed turbine base attracts more service technicians and parts inventory, improving uptime and reinforcing customer preference
- Platform lock-in: GEV's digital monitoring and services platform ties customers deeper into the ecosystem over time
4. Regulatory/IP Barriers
- Patents: Extensive turbine and grid technology IP portfolio
- Licenses: Nuclear (small modular reactors) requires regulatory approvals that take years to obtain
- Regulations: Grid equipment must meet regional utility standards and certifications — Prolec GE's existing approvals in North America represent a multi-year head start over potential entrants
Industry & Competitive Landscape
Industry Overview
- Market Size: The global power generation and grid equipment market spans hundreds of billions in annual spending, with U.S. utilities now projecting 5–7% annual load growth (vs. historical ~1–2%), driven largely by hyperscale data centers and AI infrastructure (see: Industry Overview — AI Data Center Power Demand).
- Growth Rate: Electrification equipment is among the fastest-growing segments globally. GEV's Electrification segment is forecast to grow +24% in 2025 and +19% in 2026 per Barclays, outpacing most multi-industry peers (see: Competitive Landscape — Schneider Electric). Power transformer revenue is projected to nearly double from ~$50B to ~$95B by 2030.
- Key Trends:
- AI and hyperscale data center buildout creating unprecedented electricity demand
- Global grid modernization and renewable integration driving multi-year utility capex cycles
- Severe transformer and grid hardware shortages creating supply bottlenecks
- Energy security concerns boosting demand for firm, dispatchable generation
Competitive Landscape
Major Players
-
Siemens Energy (ENR) — Closest peer in heavy-duty gas turbines, but GEV's installed base is ~720 GW vs. ENR's ~80 GW. Siemens Energy's heavy exposure to loss-making wind operations and ongoing restructuring limits its ability to expand manufacturing at pace. Trades at ~31× forward EPS (see: Competitive Landscape — Siemens Energy).
-
Schneider Electric (SU) — Competes in transformers, switchgear, and substations. Strong global footprint but more automation-heavy portfolio. GEV is better positioned in large-format grid hardware that utilities urgently need. Trades at ~20–25× forward EPS (see: Competitive Landscape — Schneider Electric).
-
Mitsubishi Heavy — Competitive in turbines but significantly smaller in global market share and has less exposure to U.S. utility and hyperscaler demand. Trades at ~43× forward EPS (see: Competitive Landscape — Other Competitors).
-
ABB / Emerson — Strong in industrial automation but lack the large-scale transformer and high-voltage hardware footprint that GEV gains through Prolec GE (see: Competitive Landscape — Other Competitors).
Competitive Positioning
No single competitor matches GEV's breadth across both firm generation (gas turbines, nuclear) and grid infrastructure (transformers, substations, high-voltage equipment). With quarterly orders of $14.6B and a combined backlog of $135.3B, GEV is uniquely positioned to serve the full energy-infrastructure buildout. Gas turbine pricing has roughly doubled to ~$2,300–2,600/kW vs. a few years ago, and GEV is ramping toward a production ceiling of ~20 GW/year by 2027 (see: Competitive Landscape — Siemens Energy; Key Risks — Mitigants).
Industry Dynamics
-
Secular Trends: AI-driven electricity demand creating a structural step-up in U.S. power consumption not seen since post-war industrialization. Global electrification of transport, heating, and industry pulling forward decades of grid capex. Policymakers emphasizing energy security and grid resilience (see: Industry Overview — all three subsections).
-
Cyclical Factors: Utilities entering multi-year replacement cycles for critical equipment (transformers, switchgear). GEV's gas turbine production is sold out through 2028, with orders extending into 2029–2030. Hyperscaler data center orders reached ~$900M YTD in Electrification alone, already exceeding full-year 2024 levels (see: Near Term Catalysts).
-
Barriers to Entry: Manufacturing heavy-duty gas turbines and large power transformers requires decades of engineering IP, regulatory certifications, and massive capital investment. GEV's 720 GW installed base creates a locked-in services annuity. The Prolec GE acquisition added scarce North American transformer manufacturing capacity in a market with multi-year delivery backlogs — new entrants cannot replicate this positioning quickly (see: Competitive Landscape; Key Risks — Mitigants).
Regulatory Environment
Energy security legislation and decarbonization policy are pulling forward utility capex on grid hardening, transmission expansion, and firm generation backup. Lengthy permitting for new power lines creates additional bottlenecks that favor incumbents with existing manufacturing and delivery infrastructure. Nuclear regulatory approvals (relevant to GEV's small modular reactor program) take years to obtain, representing a significant barrier (see: Industry Overview — Energy Security; Industry Overview — Electrification & Renewables).
Catalysts & Timeline
Near-Term Catalysts (0-6 months)
Updated 2028 financial guidance release (Investor Day)
CEO has signaled the revision will primarily reflect margin expansion, not just top-line growth. An upward revision to 2028 EBITDA guidance (currently ~$9B–$9.8B) would force Street consensus higher, compressing the forward multiple and justifying the current premium valuation. Could trigger a re-rating if margin targets exceed expectations.
Q4 2025 / Q1 2026 earnings — backlog margin step-up confirmation
Analysts expect "another large increase" in backlog margins in Q4 2025 and an even larger step-up in Q4 2026 as higher-priced gas turbine orders (~$2,300–2,600/kW) begin converting to revenue. Earnings beats driven by pricing flow-through would validate the operating leverage thesis and support EPS estimates of $12.55 for 2026E.
Headline hyperscaler / data center power partnership announcement
GEV booked ~$900M YTD in Electrification orders from data center projects alone (already exceeding full-year 2024). A major announced partnership with a hyperscaler (e.g., Microsoft, Google, Amazon) to power new server farms would signal GEV as the go-to infrastructure provider, adding to backlog and potentially expanding the multiple on Electrification earnings.
Medium-Term Catalysts (6-18 months)
rolec GE integration and North American transformer capacity ramp
Prolec GE is expected to add ~$0.8B in 2028 EBITDA at a ~7× acquisition multiple vs. peers trading at ~21×. As capacity comes online and North America rises to 40–50% of Electrification sales, the segment's margin profile should inflect from negative (2022) toward double-digit operating margins by 2027–2028. Successful integration de-risks the EBITDA bridge and could drive upward estimate revisions.
Gas turbine production ramp toward ~20 GW/year ceiling by 2027
GEV's gas turbine slots are sold out through 2028 with orders extending into 2029–2030. As manufacturing capacity ramps, revenue conversion from the $84B Power backlog accelerates. Each incremental GW of delivery at 50–60% operating leverage drives outsized EBITDA contribution, supporting the trajectory from ~$1.6B (2024) to ~$9.8B (2028).
Potential dividend initiation or shareholder return program
GEV has not yet initiated a dividend, prioritizing reinvestment and deleveraging post-Prolec. As free cash flow scales toward the company's 90–110% FCF conversion target by 2028, the introduction of a capital return program would broaden the investor base (attracting income-oriented funds) and signal management's confidence in the durability of the earnings ramp.
Valuation Analysis
Valuation Methodology
Our primary valuation approach is a Sum-of-the-Parts (SOTP) analysis, which we believe best captures GEV's distinct segment-level growth and margin profiles. We cross-check this against a forward P/E multiple framework.
Additional Valuation Methods
Comparable Companies Analysis
| Company | Ticker | Forward P/E | Notes |
|---|---|---|---|
| GE Vernova | GEV | ~47× (2026E) | Premium justified by superior growth visibility |
| Siemens Energy | ENR | ~31× | Weighed down by wind losses and restructuring |
| Mitsubishi Heavy | 7011.T | ~43× | Smaller global share, less U.S. exposure |
| Schneider Electric | SU | ~20–25× | Automation-heavy, less grid hardware leverage |
| ABB | ABBN | ~20–25× | Lacks large-scale transformer footprint |
| Eaton | ETN | ~21× EBITDA | Relevant Prolec GE acquisition comp |
GEV's premium to peers is warranted given its dual exposure to both firm generation and grid infrastructure, $135B+ backlog, and 6× EBITDA growth trajectory (2024–2028).
Precedent Transactions
The most relevant transaction is GEV's own acquisition of Prolec GE for $5.3B at ~7× 2028E EBITDA — a significant discount to peer Eaton, which trades at ~21× EBITDA. This implies the market has not yet fully priced in the accretive value of Prolec's North American transformer capacity within GEV's Electrification segment.
Sum-of-the-Parts
Using Barclays' 2028E EBITDA of ~$9.8B (including Prolec GE) and Wells Fargo's EBITDA composition (~67% Power, ~33% Electrification, Wind negligible):
| Segment | 2028E EBITDA | Multiple | Implied EV |
|---|---|---|---|
| Power | ~$6.6B | 17× | ~$112B |
| Electrification | ~$3.2B | 20× | ~$64B |
| Wind | Negligible | — | — |
| Total EV | ~$177B | ||
| (+) Net Cash | ~$12B | ||
| Implied Equity Value | ~$189B | ||
| Implied Price / Share | ~$706 |
The SOTP-derived value of ~$706/share corroborates our base-case price target of $690, which applies 52–57× to 2026E EPS of $12.55. The slight discount reflects execution risks around Prolec integration and capacity ramp, while still recognizing GEV's structurally superior earnings growth and backlog visibility.
Scenario Analysis
| Scenario | 2026E EPS | Multiple | Implied Value |
|---|---|---|---|
| Bull | ~$14 | 58× | ~$800 |
| Base | ~$12.55 | 52–57× | ~$690 |
| Bear | ~$10 | 40× | ~$400 |
Bull & Bear Cases
Bull Case
The bull case rests on GEV delivering faster-than-expected earnings growth across both Power and Electrification, driven by stronger gas turbine pricing, accelerated Prolec GE integration, and deepening hyperscaler demand. In this scenario, the market re-rates GEV as a structural compounder rather than a cyclical industrial, expanding the forward multiple.
- Gas turbine pricing surprises higher: Slot-reservation agreements continue tightening, pushing pricing beyond the current ~$2,300–2,600/kW range and lifting Power margins above consensus
- Prolec GE scales ahead of plan: North American transformer capacity ramps faster, pulling forward the ~$0.8B EBITDA contribution and accelerating Electrification's margin inflection toward double digits
- Hyperscaler order acceleration: Data center Electrification orders (already ~$900M YTD) expand materially as additional hyperscaler partnerships are announced, adding to backlog and validating GEV's scarcity value
- Operating leverage compounds: 50–60% incremental margins on accelerating revenue drive EBITDA above the ~$9.8B 2028E baseline
Upside Scenario
- Revenue growth above base case: Power backlog conversion accelerates as production ramps toward ~20 GW/year; Electrification grows >25% annually through 2027
- Margin expansion: Blended EBITDA margins expand faster as higher-priced backlog converts and Prolec's contribution mixes up Electrification profitability
- Multiple re-rating: Market assigns a structural growth premium as multi-year earnings visibility (backlog through 2029–2030) distinguishes GEV from cyclical peers
Bull Case Valuation
- 2026E EPS: ~$14 (driven by pricing beats and faster Prolec ramp)
- Multiple: 58× (reflecting re-rating toward structural compounder status)
- Upside Target: ~$800 per share (+40%)
Bear Case Scenario
The bear case centers on execution failures and demand deceleration that prevent GEV from delivering on its ambitious EBITDA bridge from ~$1.6B (2024) to ~$9.8B (2028). The high expectations embedded in the current premium multiple leave limited margin for error.
- Prolec GE integration missteps: The $5.3B acquisition fails to deliver projected synergies on schedule, delaying the ~$0.8B EBITDA contribution and eroding investor confidence in the Electrification margin trajectory
- Gas turbine pricing softens: Competitive pressure from Siemens Energy or Mitsubishi Heavy, or a slowdown in AI/data center buildout, causes pricing to plateau below ~$2,300/kW
- Wind segment losses persist or worsen: Offshore wind execution issues (cost overruns, blade failures, contract delays) divert capital and management attention, creating a drag on consolidated results
- Supply chain disruptions: Transformer and critical component shortages delay backlog conversion, pushing revenue recognition into later periods and creating near-term earnings misses
Downside Scenario
- Revenue miss: Backlog conversion slows as supply chain bottlenecks and workforce ramp challenges delay deliveries
- Margin compression: Electrification margins fail to inflect as Prolec integration costs run higher; Wind losses offset Power/Electrification gains
- Multiple compression: Market reverts GEV toward peer-average multiples (~30–35×) as growth differentiation narrows and execution risks materialize
Bear Case Valuation
- 2026E EPS: ~$10 (reflecting slower pricing, delayed Prolec, and softer demand)
- Multiple: 40× (premium narrows toward peer range)
- Downside Target: ~$400 per share (-30%)
Justification
Our bull and bear cases are anchored to the key swing variables in GEV's EBITDA bridge from ~$1.6B (2024) to ~$9.8B (2028): gas turbine pricing trajectory, Prolec GE integration pace, and the rate of Electrification margin inflection.
Probability weighting: We assign approximately 60% to the base case, 25% to the bull case, and 15% to the bear case. The skew toward base/bull reflects the structural nature of demand drivers (AI power buildout, grid modernization) and the fact that GEV's gas turbine production is already sold out through 2028 — limiting downside to revenue volume. The bear case requires multiple simultaneous failures (pricing softness, integration missteps, and demand deceleration), which we view as a lower-probability tail.
Key assumption differences:
| Variable | Bull | Base | Bear |
|---|---|---|---|
| 2026E EPS | ~$14 | ~$12.55 | ~$10 |
| Gas turbine pricing | Accelerates above $2,600/kW | Holds at $2,300–2,600/kW | Plateaus below $2,300/kW |
| Prolec GE 2028 EBITDA | >$0.8B (ahead of plan) | ~$0.8B (on track) | <$0.5B (delayed) |
| Forward multiple | 58× (re-rating) | 52–57× (maintained premium) | 40× (compression to peers) |
The SOTP cross-check (~$706/share on 2028E EBITDA) provides independent confirmation that our base-case PT of $690 is not dependent on aggressive multiple assumptions alone, but is supported by fundamental segment-level economics.
Key Risks
Supply Chain Constraints in Electrification
The Electrification segment faces global shortages of critical components, particularly high-voltage transformers. Delays could hinder GEV's ability to convert its $30.18B Electrification backlog on schedule, pushing revenue recognition into later periods and creating near-term earnings misses.
Offshore Wind Losses and Capital Diversion
GEV's Wind segment has been volatile and historically loss-making, with revenue falling 8% YoY in FY25 and ongoing EBITDA losses. Execution issues (cost overruns, blade failures, contract delays) could divert capital and management attention from the higher-return Power and Electrification segments.
General Execution Risk on EBITDA Ramp
GEV is targeting a ~6× EBITDA expansion from ~$1.6B (2024) to ~$9.8B (2028), requiring successful Prolec integration ($5.3B acquisition), manufacturing capacity ramp to ~20 GW/year, and workforce scaling — all simultaneously. There is little room for error at the current premium valuation (~47× 2026E EPS).
AI & Data Strategy
- Grid Software & Digital Twins: GEV's Grid Software unit provides utilities with digital grid management, monitoring, and optimization tools. These software subscriptions carry high margins, require minimal capital, and deepen customer lock-in to GEV's hardware ecosystem.
- Lean Manufacturing & Predictive Analytics: Internally, GEV applies data-driven process optimization across its factory floors and supply chains, inherited from GE's legacy of continuous improvement under CEO Larry Culp. This supports the 50–60% operating leverage that amplifies pricing and volume gains.
ESG & Governance
Environmental Factors
- Carbon footprint: GEV's Power segment is heavily tied to natural gas combustion, making it a significant emitter. However, gas turbines serve as the firm dispatchable backup that enables higher renewable penetration — a "transition fuel" narrative that positions GEV favorably under most policy frameworks.
- Climate risk exposure: Physical climate risks (extreme weather) actually drive demand for GEV's products — grid hardening investments rise as utilities seek to mitigate weather-related outages. Transition risk is moderate, as hydrogen-capable turbine R&D provides a decarbonization pathway.
- Environmental initiatives: ~$1B/year R&D investment includes hydrogen-fueled turbines and next-gen nuclear (SMRs), positioning GEV for long-term energy transition. Grid digitalization efforts also support energy efficiency.
Social Factors
- Labor practices: As a newly independent company, GEV is scaling its workforce significantly to meet record backlog. Successful hiring and retention — particularly skilled manufacturing labor for transformer and turbine production — is critical to execution.
- Community impact: GEV's products directly support grid resilience and energy security, with positive community impact through reliable power delivery and infrastructure modernization.
Governance
- Board composition: GEV benefits from the governance reset that came with the GE spin-off, establishing an independent board structure focused on the energy technology business.
- Executive compensation: CEO Scott Strazik leads execution, carrying forward the lean manufacturing culture established by Larry Culp at GE. Compensation alignment with EBITDA and FCF targets is a positive signal.
- Capital allocation discipline: Management has prioritized reinvestment and deleveraging over shareholder payouts (no dividend yet), with FCF directed toward high-ROI investments like Prolec GE. Target of 90–110% free cash flow conversion by 2028.
Regulatory Exposure
- Energy policy and permitting regulations are a double-edged sword: they create demand for GEV's products (grid upgrades, firm generation mandates) but also constrain the pace of buildout (lengthy transmission line permitting). Nuclear regulatory approvals for SMRs represent a multi-year barrier that protects GEV's early-mover position.
Conclusion
Summary
We initiate with a Buy recommendation and a 12-month price target of $690 (~+17% upside), based on a SOTP-derived valuation of ~$706/share cross-checked against a 52–57× forward P/E on 2026E EPS of $12.55.
GE Vernova is the most leveraged public-market beneficiary of the AI power supercycle — uniquely positioned across both firm generation (gas turbines, nuclear) and grid infrastructure (transformers, substations). A $135B+ multi-year backlog, 50–60% operating leverage, and the accretive Prolec GE acquisition support an EBITDA trajectory from ~$1.6B (2024) to ~$9.8B (2028). The current premium valuation is warranted by superior growth visibility that no single peer can match.
Key Risks to Monitor
- Prolec GE integration execution — track quarterly Electrification margin progression toward double digits; any sustained delays to the ~$0.8B 2028 EBITDA contribution would pressure the thesis
- Gas turbine pricing sustainability — monitor slot-reservation pricing on new orders; a plateau below ~$2,300/kW would signal competitive pressure or demand softening
- Wind segment losses — watch for capital or management attention diversion; Wind should remain <1% of valuation contribution
Catalysts to Watch
- Updated 2028 financial guidance (Investor Day, date TBD) — CEO has indicated the revision will focus on margin expansion; an upward EBITDA revision would force consensus higher
- Q4 2025 earnings — expected to confirm "another large increase" in backlog margins as higher-priced gas turbine orders begin converting
- Hyperscaler partnership announcements — additional data center power deals beyond the ~$900M YTD Electrification orders would validate GEV's positioning as the go-to infrastructure provider
Important Disclosures
This report has been prepared by St. George Capital for educational purposes only. It does not constitute investment advice or a solicitation to buy or sell securities. St. George Capital and its members may hold positions in the securities discussed. Past performance does not guarantee future results. Investors should conduct their own due diligence and consult with qualified financial advisors before making investment decisions.